Minister Chris Bishop recently put out a press release celebrating new infrastructure investment. It's been one of many recently telling New Zealanders that the economy is moving again. Some, like the recent figure of $6bn in new investment, were also fronted by the Minister of Finance, Nicola Willis.
Apparently, this recent announcement from the government is “great news for the construction sector and the wider economy”. Given that around 17,000 fewer people are working in construction, and building consents are down significantly since the election, we could take all the help we can get. But do those figures actually mean anything?
The press release said that the last three months had seen a bump of $30bn in the pipeline. That’s a lot of cash. That’s the same as we spend on health each year. If there were an increase of that magnitude, it would be a very significant win. It made me go – what’s really happening here? So I had a look – you can too at https://tewaihanga.govt.nz/the-pipeline/pipeline-snapshot
What that data shows is that ‘$30bn’ isn’t actually what is being built – it’s what been added to the plans for the next ten years. In June 2,586 projects with $52.85bn were under construction. Around half ($25.6bn) of all that that has nothing to do with central government. And much of what remains are projects being finished that were commenced years ago and have nothing to do with this government.
The PR claims “The Commission’s projections show at least $17.5 billion in projected potential spend across 2025”. This is true – except “This figure is a $0.9 billion increase in projected spend for 2025 relative to our previous projections”. So its not $17.5bn of new spending. Also, next year in 2026, it is currently projected to fall to $16.6bn.
$17.5bn might sound like a lot – but again it's not a big number. “Commission research indicates over the last 20 years, New Zealand spent an average of 5.8% of gross domestic product (GDP) on infrastructure. The $17.5 billion is around 4.1% of GDP”. Historically, we have underspent on infrastructure, and this is even less than that historical underspending.
Pipeline figures increase every year because more entities provide information to the pipeline – not because we actually build more stuff. The pipeline states, “A large portion of this increase [the $30bn] came from funded and future initiatives relating to New Zealand-wide state highway maintenance activity spanning 2024-2034, and low-cost-low-risk transport programme activity spanning 2023-2030. This is the first time we have been able to include this information in the Pipeline”.
Programmes also go up in cost – not because we buy more stuff. Of that $30bn 25% is “Adjustments to previously reported initiatives had a net result of adding a further $7.5 billion in value”. And “Over 60% of this increase was driven by a change in approach to reporting to better reflect the full potential costs and scope for initiatives, rather than by a change in initiative scope or cost.”
Projects get included in the report without any funding. 47% of all projects in the pipeline have no funding attached to them. My back garden on this basis would be an infrastructure project in the pipeline.
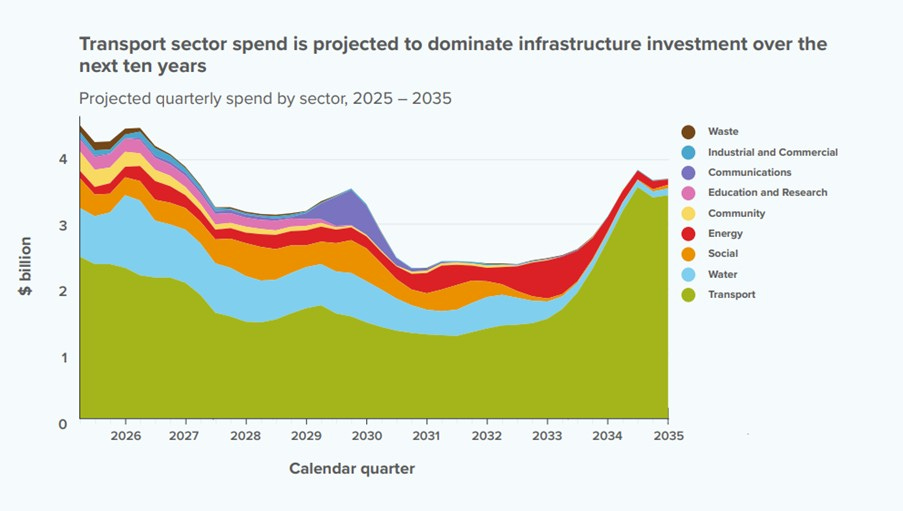
The pipeline also demonstrates the failure of imagination that the government has when it comes to infrastructure. Almost all of the pipeline further out is roading. Water infrastructure – so badly needed – gets squeezed every year. There are 6 projects right now that have money and are being delivered for electricity supply. 5 of them are worth less than $25m each and 3 are worth less than $1m each.
Figure 1: Infrastructure Pipeline Analysis
Source: Infrastructure Commission
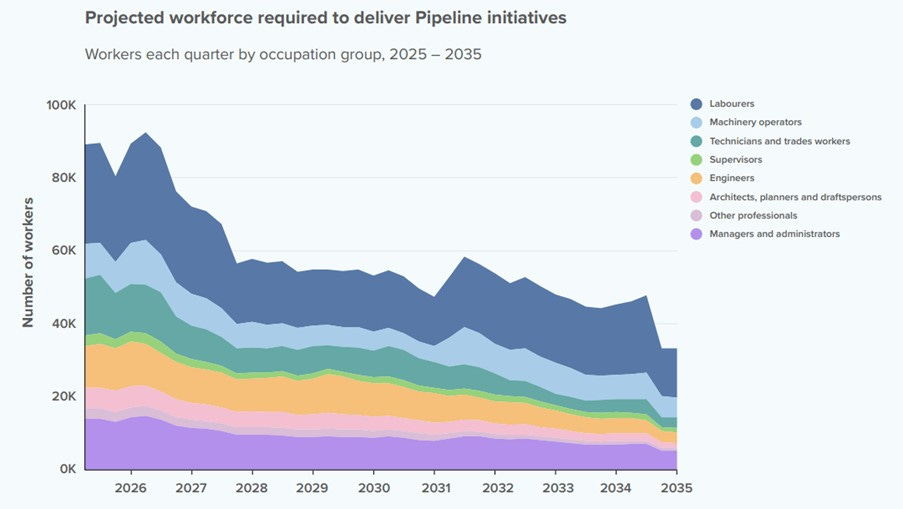
Figure 2 below shows the total workforce required to deliver the current pipeline of work. It is projected to fall right across the 10-year forecast period. This will fall by more than half from 90,000 now to around 40,000 by 2035. If the pipeline was supposed to encourage employers to invest in their workforce, its currently doing the opposite.
Figure 2: Infrastructure workforce requirement
So, let’s recap. The country is in an infrastructure crisis after years of underfunding and underinvestment. There is a spare workforce that we are consistently losing overseas due to a lack of work. We have increasing homelessness and falling residential consent numbers. We have no strategy to deal with the warnings about blackouts in 2026 except for deindustrialisation and plant closures.
Despite all of this, and despite the fact that the economy is likely to turn negative again in the June data last this month, we have found more than $23bn in tax cuts over two Budgets. The number of people on Jobseekers is forecast to rise by 50,000 since the election. We still have no boats. Amazon still doesn’t have a data centre despite all he claims made recently.
The pipeline tells us what we already know. That there is no plan to deal with the infrastructure problems facing the country. Just a desire to have a series of flashy numbers that the government can use for promotional purposes. I am reminded of the Australian TV show Utopia, where ministers jostle to be on TV in high viz while nothing actually gets done at the department called Nation Building Australia. It’s supposed to be a satire – not an instruction manual.


Brilliant work Craig. Luxon is providing a superb real-time lesson in systems dynamics, particularly with regard to what happens when you completely ignore each and every feedback coming from the system. It is starting to feel like crashing the economy is his government’s strategy. What a mess, a completely self-inflicted mess. I’m well beyond anger now. It’s just one long depressing story after another, and it show no signs of stopping. So very bloody sad. 😔
So at best it is just more Spin, or probably and more accurately Lies. Until the media actually start doing their job people ( stupid people really ) will believe this kaka.